You are not logged in.
- Topics: Active | Unanswered
Pages:: 1
#1 2015-05-21 06:10:40
Data Interpretation Graph:
Directions:
Study the following graph carefully and answer the questions given below:
Distribution of candidates who were enrolled for MBA entrance exam and the candidates (out of those enrolled) who passed the exam in different institutes: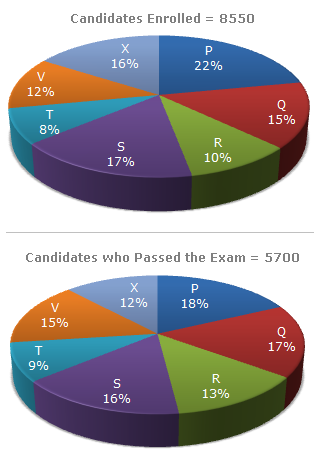
Question:
The number of candidates passed from institutes S and P together exceeds the number of candidates enrolled from institutes T and R together by:
Option A):
399
Option B):
279
Option C):
407
Option D):
228
Correct Answer is Option A):
399
Explanation: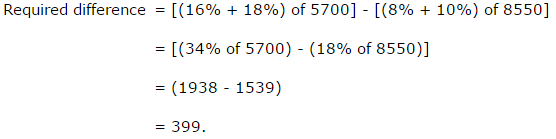
Failure is the first step towards seccess.
Offline
2015-05-21 06:10:40
- Advertisement
- Ads By Google
Re: Data Interpretation Graph:
\n
Pages:: 1