You are not logged in.
- Topics: Active | Unanswered
Pages:: 1
#1 2015-05-22 05:15:07
Data Interpretation Percent:
Directions:
Study the following line graph which gives the number of students who joined and left the school in the beginning of year for six years, from 1996 to 2001.
Initial Strength of school in 1995 = 3000.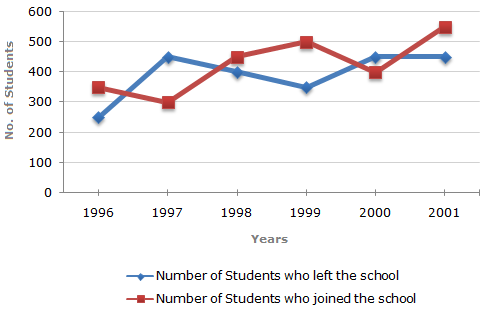
Question:
The strength of school incresed/decreased from 1997 to 1998 by approximately what percent?
Option A):
2.1%
Option B):
1.2%
Option C):
2.4%
Option D):
1.7%
Correct Answer is Option D):
1.7%
Explanation:
Important data noted from the given graph:
In 1996 : Number of students left = 250 and number of students joined = 350.
In 1997 : Number of students left = 450 and number of students joined = 300.
In 1998 : Number of students left = 400 and number of students joined = 450.
In 1999 : Number of students left = 350 and number of students joined = 500.
In 2000 : Number of students left = 450 and number of students joined = 400.
In 2001 : Number of students left = 450 and number of students joined = 550.
Therefore, the numbers of students studying in the school (i.e., strength of the school) in various years:
In 1995 = 3000 (given).
In 1996 = 3000 - 250 + 350 = 3100.
In 1997 = 3100 - 450 + 300 = 2950.
In 1998 = 2950 - 400 + 450 = 3000.
In 1999 = 3000 - 350 + 500 = 3150.
In 2000 = 3150 - 450 + 400 = 3100.
In 2001 = 3100 - 450 + 550 = 3200.
Percentage increase in the strength of the school from 1997 to 1998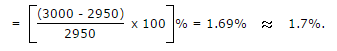
Failure is the first step towards seccess.
Offline
2015-05-22 05:15:07
- Advertisement
- Ads By Google
Re: Data Interpretation Percent:
\n
Pages:: 1